
You can review your current and historical email sending reputation using the email health dashboard. Review the key metrics of your marketing email performance, including your overall open rate, click-through rate, unsubscribe rate, spam reports, and hard bounce rate, and get recommendations on how to improve your deliverability and performance. Please note:
- You must meet a threshold of 400 emails sent in the last 30 days to view the email health dashboard.
- The email health reports and engagement breakdowns do not include the last 48 hours of data.
Review your email sending health
- In your HubSpot account, navigate to Marketing > Email.
- Click the Health tab.
- Your email health data is split into several different reports, to allow you to analyze a snapshot of your current sending health, review historical trends, and determine whether your aggregate email metrics are on track.
- Your email health will be summarized by an overall health score, which is based on your aggregate email engagement metrics over the past 30 days. This health score is percentile-based, which maps to an assessment that's based on your numerical score:
- 1 - 2: Poor
- 3 - 4: Needs work
- 5 - 6: Okay
- 7 - 8: Good
- 9 - 10: Excellent
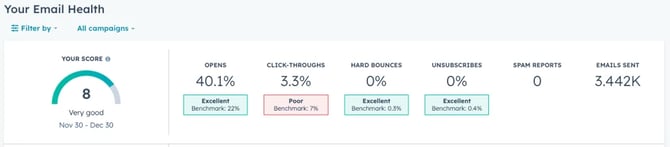
- Your aggregate engagement metrics, including Opens, Click-throughs, Hard bounces, Spam reports, and Unsubscribes are provided in the left column of the email health dashboard, along with your Score over time for the past twelve months.
- Based on your recent email engagement history, the Top recommendations for you section provides recommendations that you can prioritize as you iterate on your email sending strategy.
- Your high performing emails (up to ten emails sent in the past 30 days that scored well in all deliverability metrics) and low performing emails (up to ten emails that scored poorly in at least one deliverability metric) will also be listed on the dashboard, along with their associated performance metrics. You can also view high and low performing contact segments.
- To compare your email performance, by default email health metrics are compared to a general benchmark. To use industry-specific benchmarks instead, click Select your industry in the banner at the top of the page, select your industry from the dropdown, and click Save.
- To filter the data further, click the filter icon at the top of the page, then select a filter type:
- Campaign: if you have a Marketing Hub Professional or Enterprise account, you can review email health data by campaign.
- Email type: filter by regular, automated, transactional, or emails sent based on recipient time zones.
- Subscription type: filter by email subscription types.
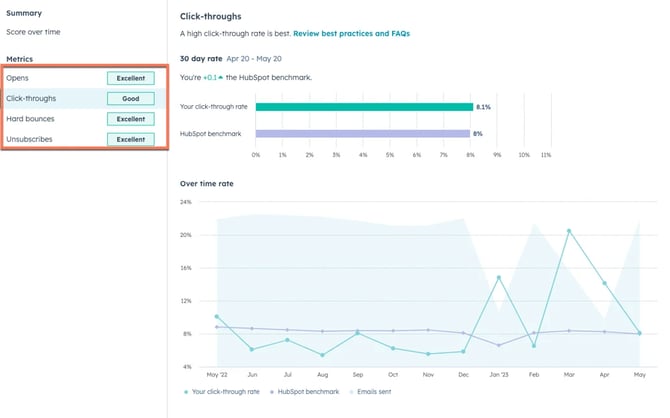
Please note: comparing email health by industry is only available for some industries.Analyze breakdowns of your email health metricsIn the Metrics section of the left column, click a metric name to view it over time. The available metrics are:
- Opens: if you've enabled email open tracking, you can see the overall percentage of email recipients who opened your email.
- Click-throughs: if you've enabled email click tracking, your overall click-through rate is the percentage of people who clicked on a link in your email, out of the total number of recipients who opened your email.
- Hard bounces: your hard bounce rate is the percentage of emails that HubSpot couldn't deliver due to an issue reported by the recipient's email server.
- Spam reports: the number of times that contacts reported one of your emails as spam to their email provider, or manually dragged the email from their inbox into their junk folder. These contacts will be dropped from future emails.
 Please note: spam reports from Gmail are not included in this metric within HubSpot, as Google uses a proprietary method for reporting that doesn't provide granular data on each recipient. To monitor Gmail complaints outside of HubSpot, you can set up and use Google's Postmaster Tools.
- Unsubscribes: your unsubscribe rate is the percentage of people who chose to unsubscribe from your marketing emails, out of the total number of recipients who were delivered your email.
- To view and analyze a detailed breakdown of each metric, click the metric in the left sidebar. In the breakdown view, you'll see a detailed explanation of what the metric means, why it's important, recommendations to help you improve your deliverability, and a report on how you compare to the HubSpot benchmark.
- You can also return to the default view by clicking Score over time in the left sidebar menu to analyze how your health score has changed over the last year.